
Retail Industry Need Timely Insight and Rapid Market Feedback
vividime's Solution for Retail Industry
Data Source
Collecting data in the retail industry is a challenging task. Firstly, the data in the retail industry is complex and diverse, including raw materials, transportation, processing, sales, and others. Secondly, data collection in the retail industry is a tedious task because there are too many sources of data. Every branch and franchisee needs to transmit data to the headquarters. This leads to excessive data and lack of timeliness.Hard to have all the data.
Decisions Based on Experience
The decision-making process in the retail industry largely relies on experience. Each branch and franchisee relies on the decisions of local leaders to determine the actions of the store, as they cannot obtain information about other stores and the overall industry. Experience often fails to accurately predict the future.
Hard to Analyze Data
The data in the retail industry is mostly in the form of tables, which places high demands on the viewers. Business personnel need a high threshold to understand this type of data. Even with sufficient data, how to process it into usable reports is still a problem that the retail industry needs to face.
Unified Data System
A unified and interconnected data system is the foundation of everything. It can enable the entire enterprise to gain the ability to view problems from a higher perspective, and also provide decision-makers for each branch and franchisee with a better perspective. Our vividime supports all the major database connections, and we also provide the data cleaning function that can help building this data system.
Various Models
Provide different analysis models for different perspectives to help different business personnel obtain data models that are consistent with their work areas. With vividime’s self-service modeler, even people who know nothing about SQL can also build datasets by drag and drop.
Easy Dashboards
Create different dashboards to access data from various businesses, providing business personnel with a simpler way to analyze their own operations. Our vividime provide over 80 components to help users to build their dashboards, and business personnel can use drag and drop to create beautiful dashboard for themselves.
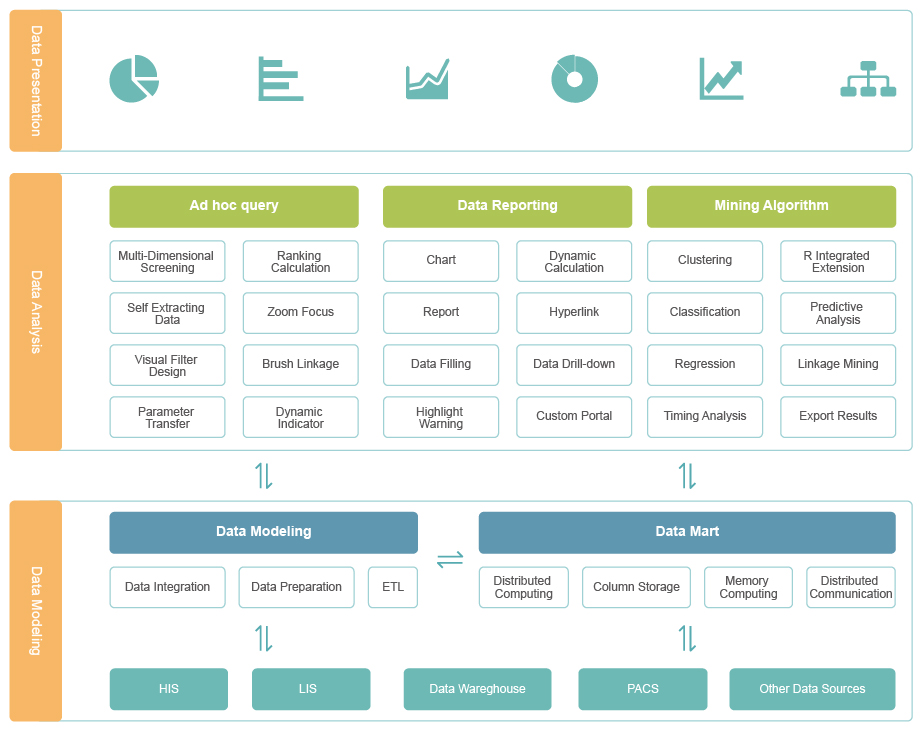
Data Layer:
Integrate different business information systems to achieve a holistic view of data. Modeling Layer:
Modeling Layer:
Establish different analysis themes for different analysis perspectives.
Display Layer:
By presenting rich and beautiful charts and flexible interactive methods, the analysis results are presented to decision-makers and business users. IT and business departments can make different presentations based on their own needs.
Sales Module:
Charts used: Gauge, table, bar charts, and line charts.
Focusing on sales revenue, number of customers, and unit price, in order to visually see the effectiveness of the operation.
Focusing on the year-on-year and month on month changes in sales indicators data, in order to timely discover new trends in customer traffic.
Product Module:
Charts used: table, bar charts, line charts, and etc.
Focusing on the product structure and ensure appropriate proportion relationships for categories such as fresh produce, food, and daily necessities to ensure customer flow and user stickiness.
Focusing on the product inventory, SKU quantity, turnover days, retail products, and zero inventory products to ensure that best-selling products are not out of stock and unsold products are cleared through activities
Financial Module:
Charts used: table, bar charts, line charts, and etc.
Focusing on the gross profit, expenses, and profits, with a particular emphasis on indicators with significant changes, in order to promptly identify key information.
Focusing on the profit and cost situation of different regions and products. Track the allocation of different regions and product categories.
Service Module:
Charts used: table, bar charts, line charts, and etc.
Focusing on the customer flow, stay time, and waiting time, in order to directly inspect market activities, adjust product structure ratios, and adjust service methods.
Focusing on the types of returns and promptly identify operational issues through normal and abnormal returns.
1. Meet the needs of decision-makers for timely understanding and rapid analysis of operational situations.
2. When there are changes in front-end requirements, it can quickly respond to the requirements and improve the work communication of the IT department.
3. Visualize operational data such as sales, products, finance, and services for self-service display.
4. Integrate existing business system data, improve the perspective of viewing data, and quickly display large amounts of data.